Fundamentals of experimental design and analysis
BIOL2022 - L01
HATPC
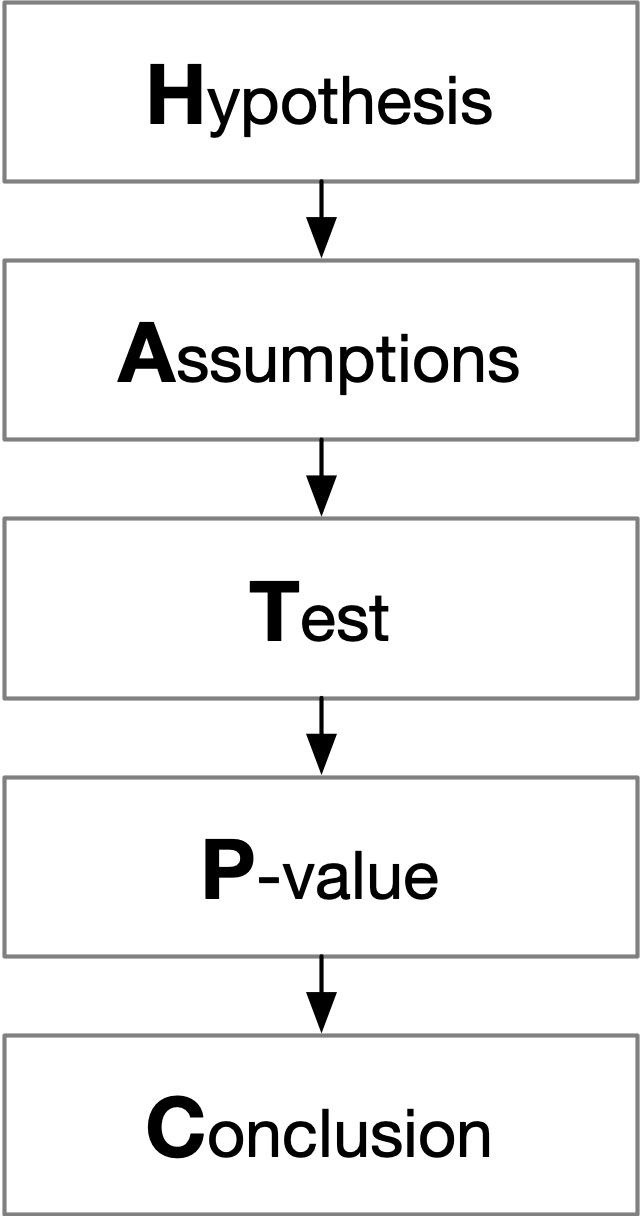
HATPC, used in several data science units at the University of Sydney.
Logical framework1
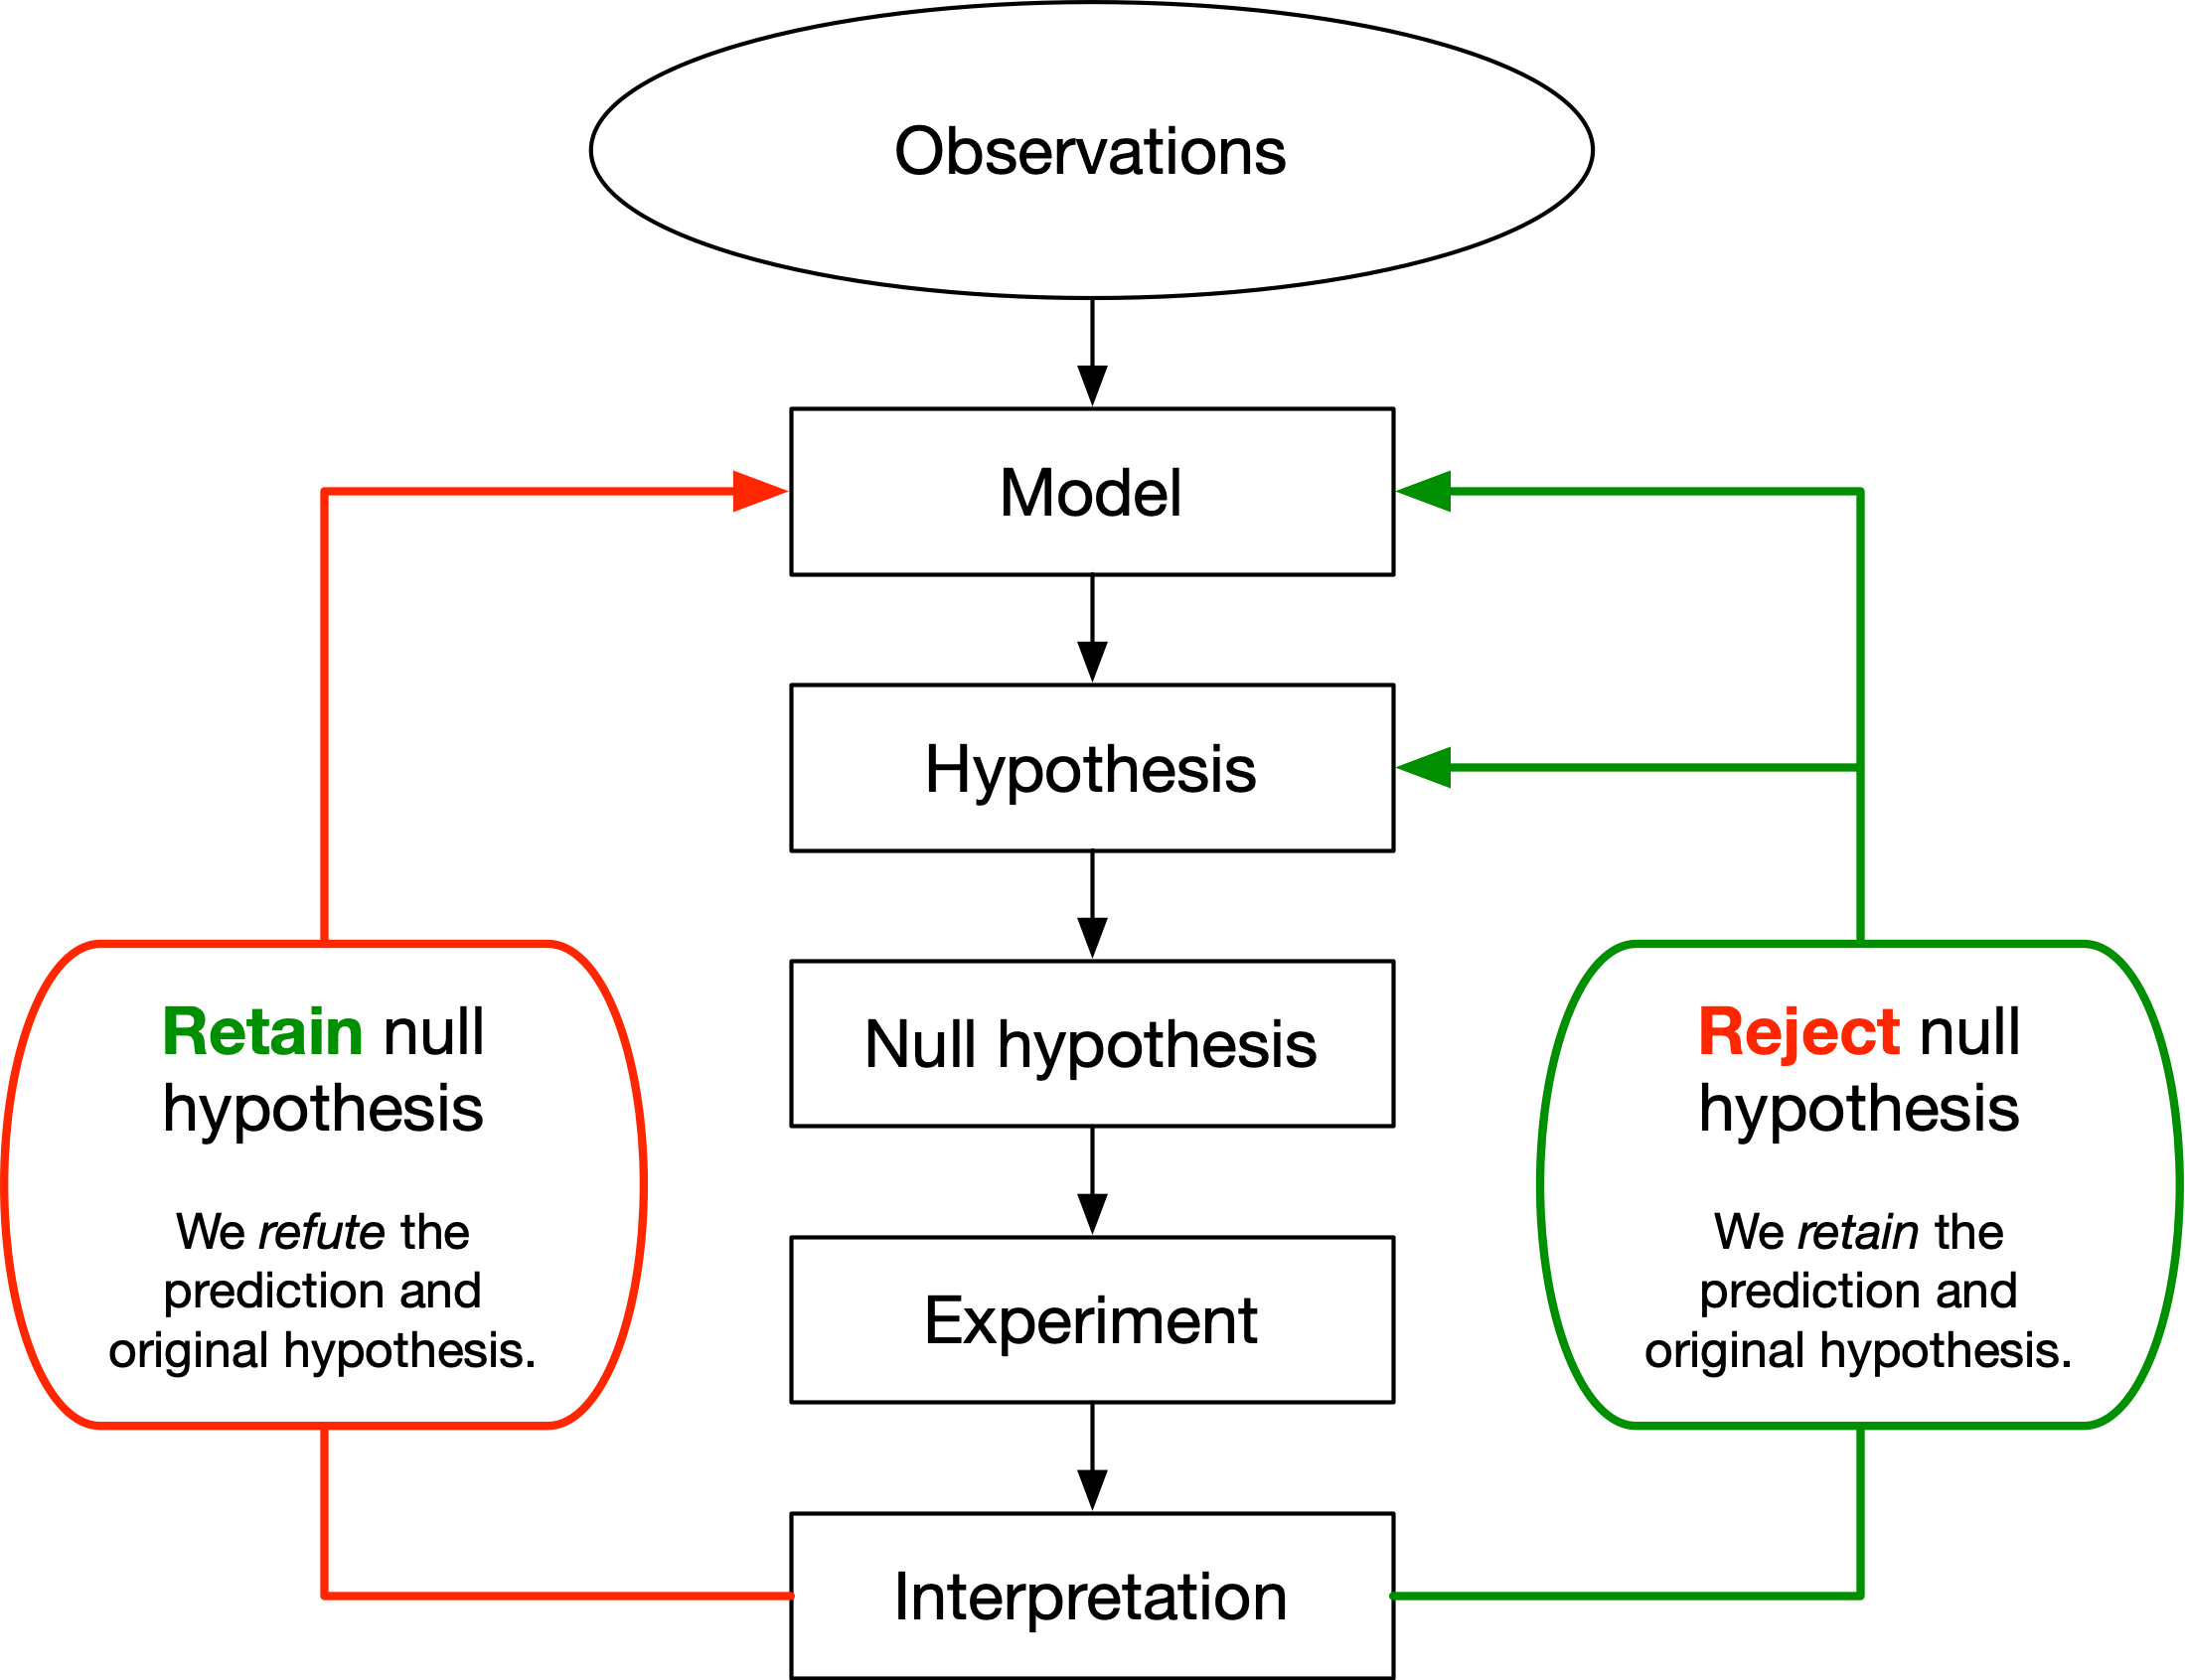
A logical framework for ecological research proposed by Underwood (1997).
1Underwood AJ (1997) Experiments in Ecology: Their Logical Design and Interpretation using Analysis of Variance. Cambridge University Press, Cambridge.
Experimental design workflow2
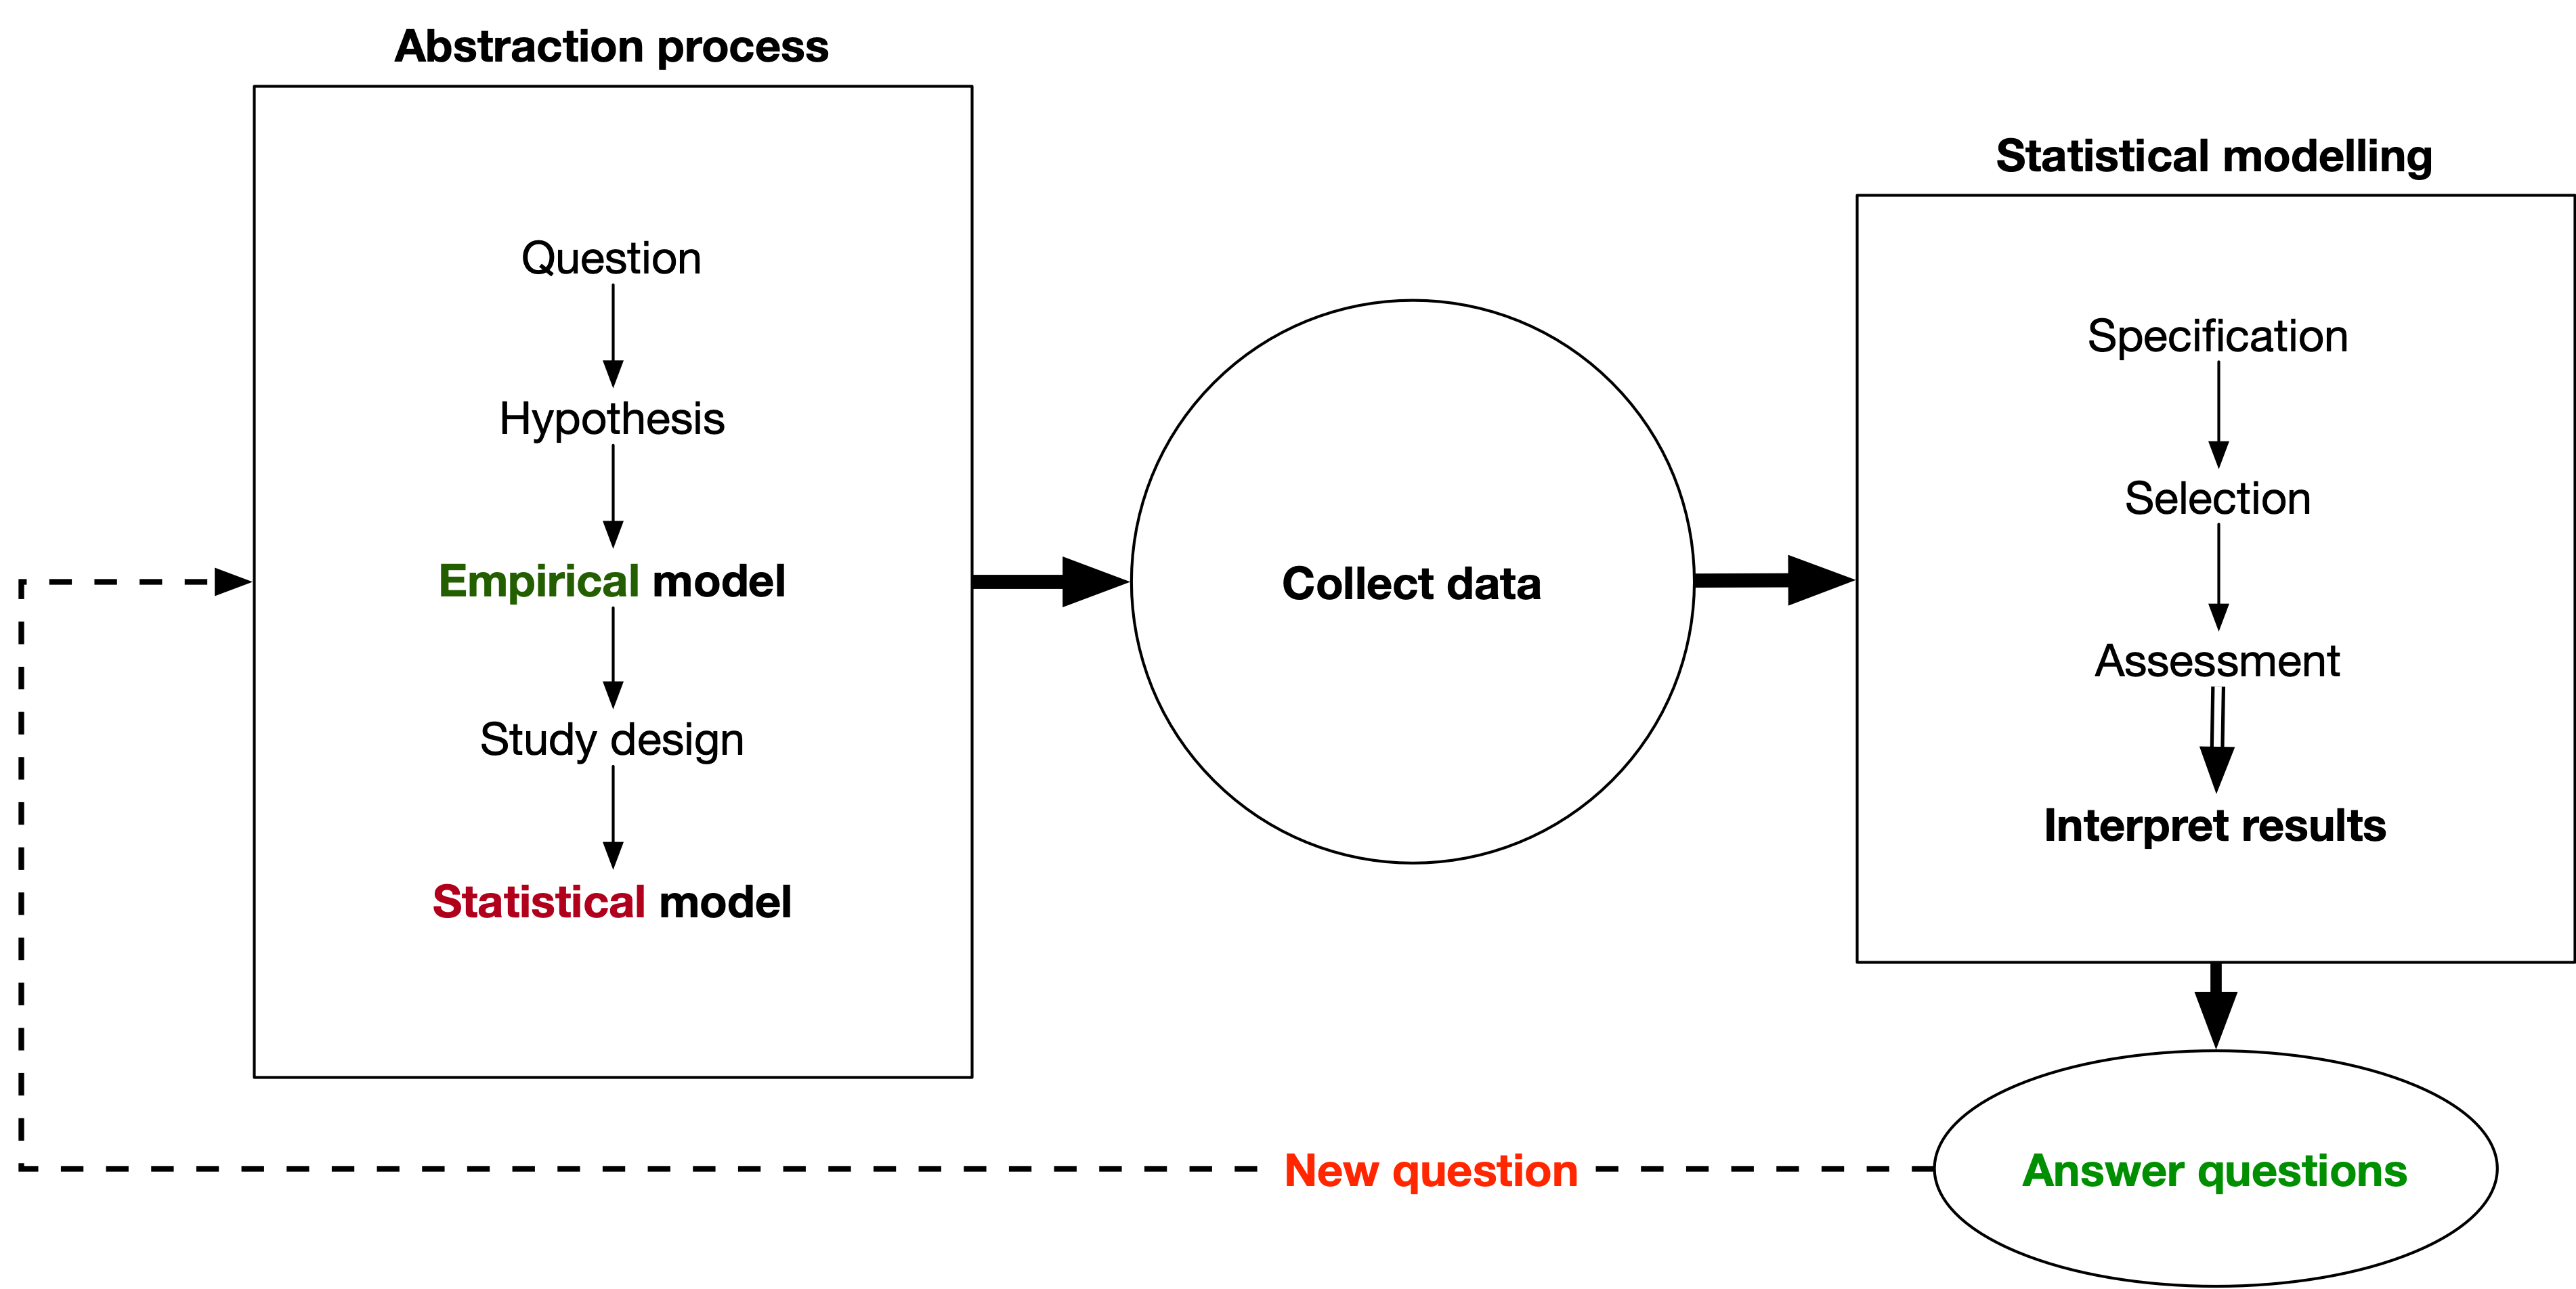
A model-centred approach to experimental design from Fox et al. (2015).
3Fox, G. A., S. Negrete-Yankelevich, and V. J. Sosa. (2015). Ecological statistics: contemporary theory and application. Oxford University Press, USA.
What are models?

What does this represent? Licensed from Adobe.
This model retains enough information to describe the terrain without showing any value.
Models:
- focus on relationships between variables.
- help us explain patterns and make predictions.
Traditional statistics
| Biological question | Predictor | Technique |
|---|---|---|
| Do two groups differ? | Two categories | t-test |
| Do several groups differ? | Several categories | ANOVA |
| Is there a “relationship”? | Continuous measurement | Linear regression |
Many of us have learnt statistics as a set of techniques, often relying some kind of decision tree.


A model-centred view
A model-centred view
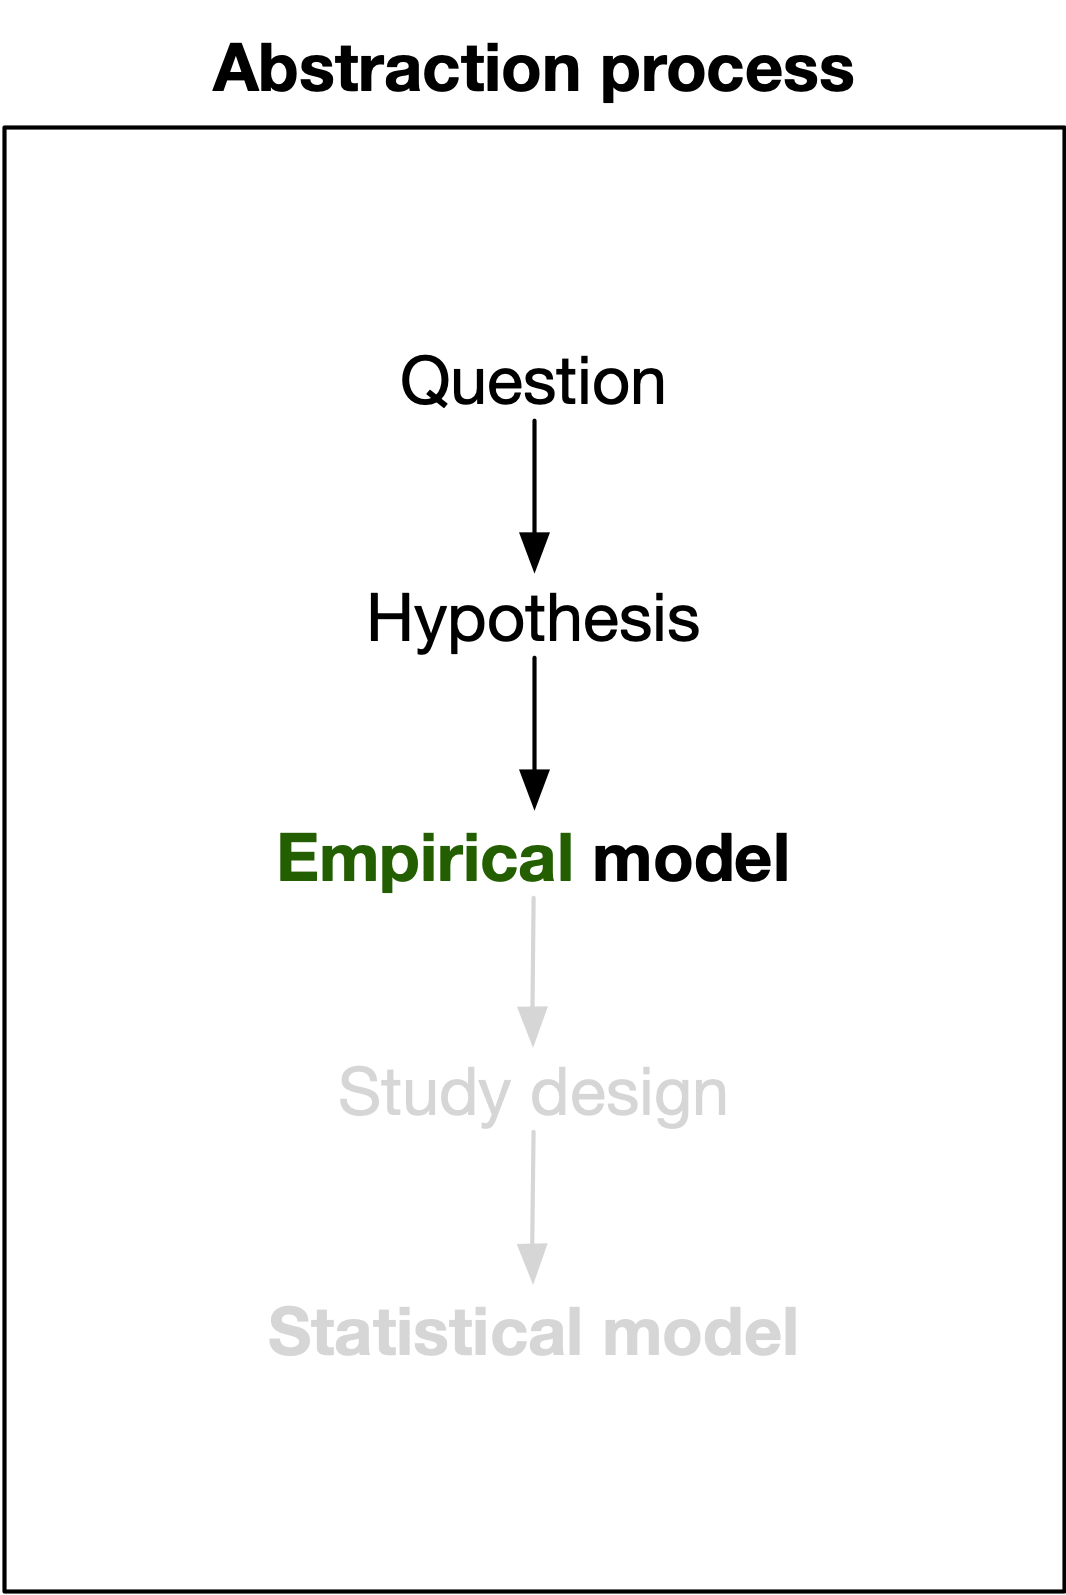
- No data or statistics to worry about (yet)
- Focus on the relationship between variables
- Question: “Is there a relationship?”
- Hypothesis: “There is a relationship between the variables.”
- Empirical modelling:
- Response variable is what we want to explain.
- Predictor variable(s) are what we think might explain the response.
The statistical model will eventually be a general linear model (GLM) with special cases, but we do not necessarily need to identify the “formal” name.
Example - sea urchins

Building the empirical model
- Question: “How does water temperature affect metabolic rate?”
- Hypothesis: “Metabolic rate will increase as water temperature increases.”
- Empirical model:
- Response: metabolic rate
- Predictor: water temperature
- Expected relationship: positive
Temperature along a gradient
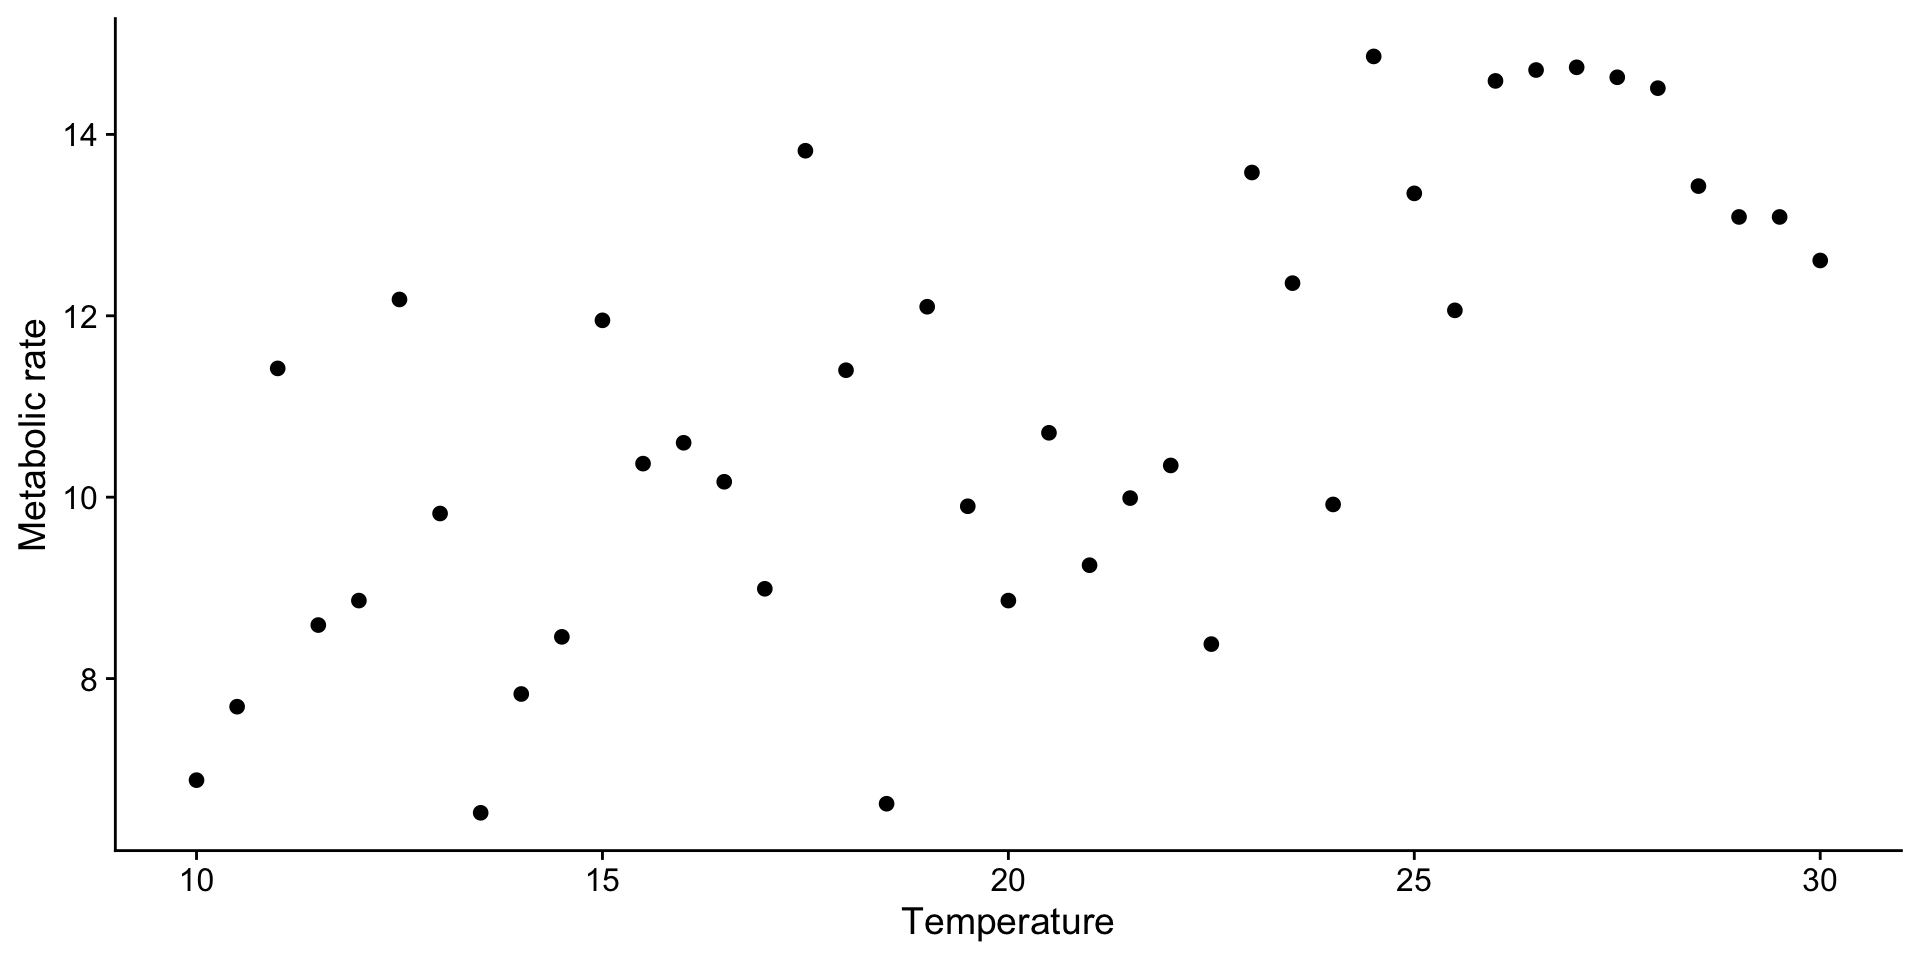
We could expose urchins to a range of temperatures and ask how their metabolic rate changes.
Temperature as treatment groups
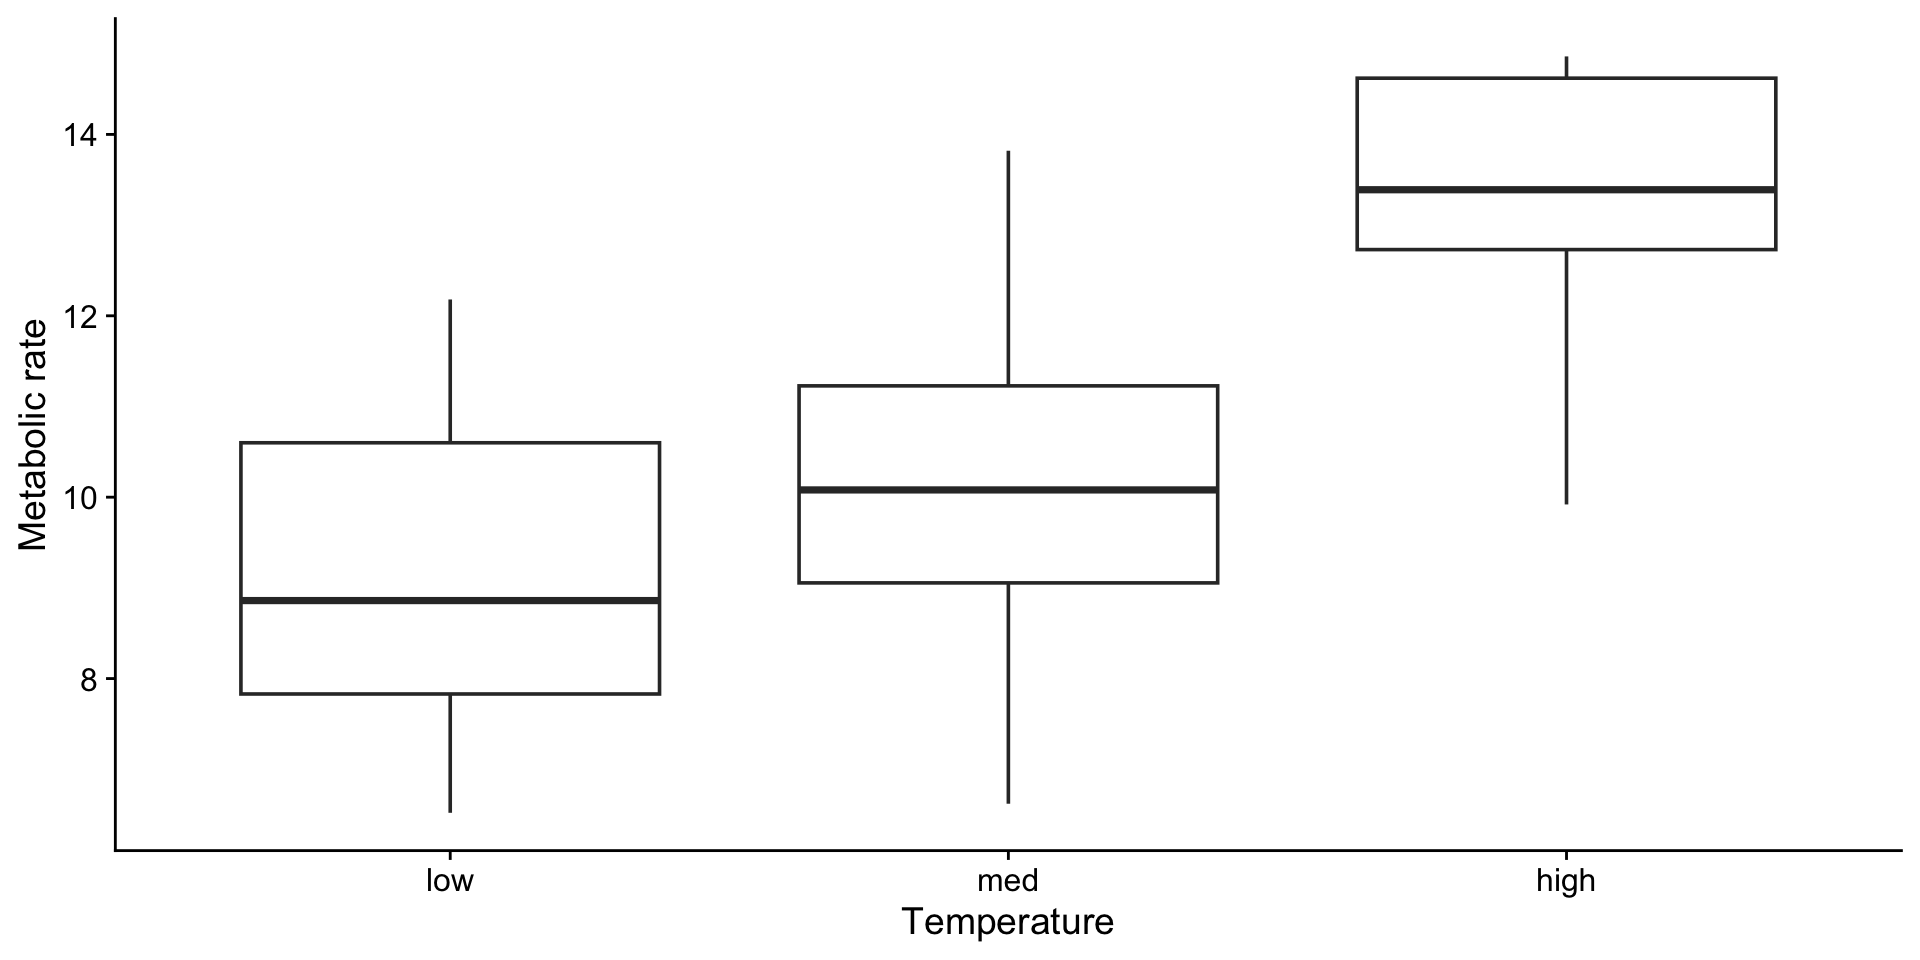
Or we could choose a few temperatures and compare metabolic rate among the groups.